


Biotech Valuation: A Practical Guide
In Part 2 of this series on biotech investing, we develop a valuation framework for biotech stocks before their drugs hit the market.

If you read and applied Part 1 of this series on biotech investing, congratulations - you’ve done the hard part.
Now comes the easy part which is taking all the information and putting it into numbers to see if the stock is worth investing based on your research.
If you want to follow this tutorial interactively and apply it to your own stock of interest, you can download this spreadsheet.
For starters, we have to distinguish price from value. Price is what you pay, and value is what you think it’s worth. If you’re looking to buy a stock, you essentially want to identify companies where the stock price is lower than your valuation of the company
Here, I’ll show you one way to do this by applying a risk-adjusted net present value (rNPV) model. Essentially, we will look at all the therapeutics in the pipeline of a biotech company, estimate their likelihood of approval based on available (pre-)clinical data, estimate how much this therapeutic could earn if it were to enter the market, and calculate how much these future cash flows are worth today. Then, we will evaluate which assumptions that we made have the strongest impact on the valuation, and how changes in these assumptions impact the valuation of the company by performing a so-called sensitivity analysis. Finally, we bring it all together by calculating a fair per-share value of the company and compare it to the actual stock price.
This is by no means the only way to do it, and I will try to point out limitations of this model as we go. However, this valuation method is widely used by analysts and will generally work well with early-stage clinical-stage biotech companies that do not have revenue from therapeutics yet.
Step 1: Put Numbers to Assets

Let’s take a look at Quoin Pharmaceuticals, a clinical-stage biotech with four different therapeutics in the pipeline (image above). Their lead asset is QRX003, a broad-spectrum serine protease inhibitor that is in phase 2/3 trials for Netherton Syndrome. Our first task is to evaluate potential revenue opportunities from these four products.
To do this, we need to make a couple of assumptions. Patient number, market share1, sales (list) price2, year of approval, and the year in which sales may peak all contribute to the expected future cash flows generated by the different pipeline products. Based on your research about a company from part 1, you can add your assumptions in a table such as this one:
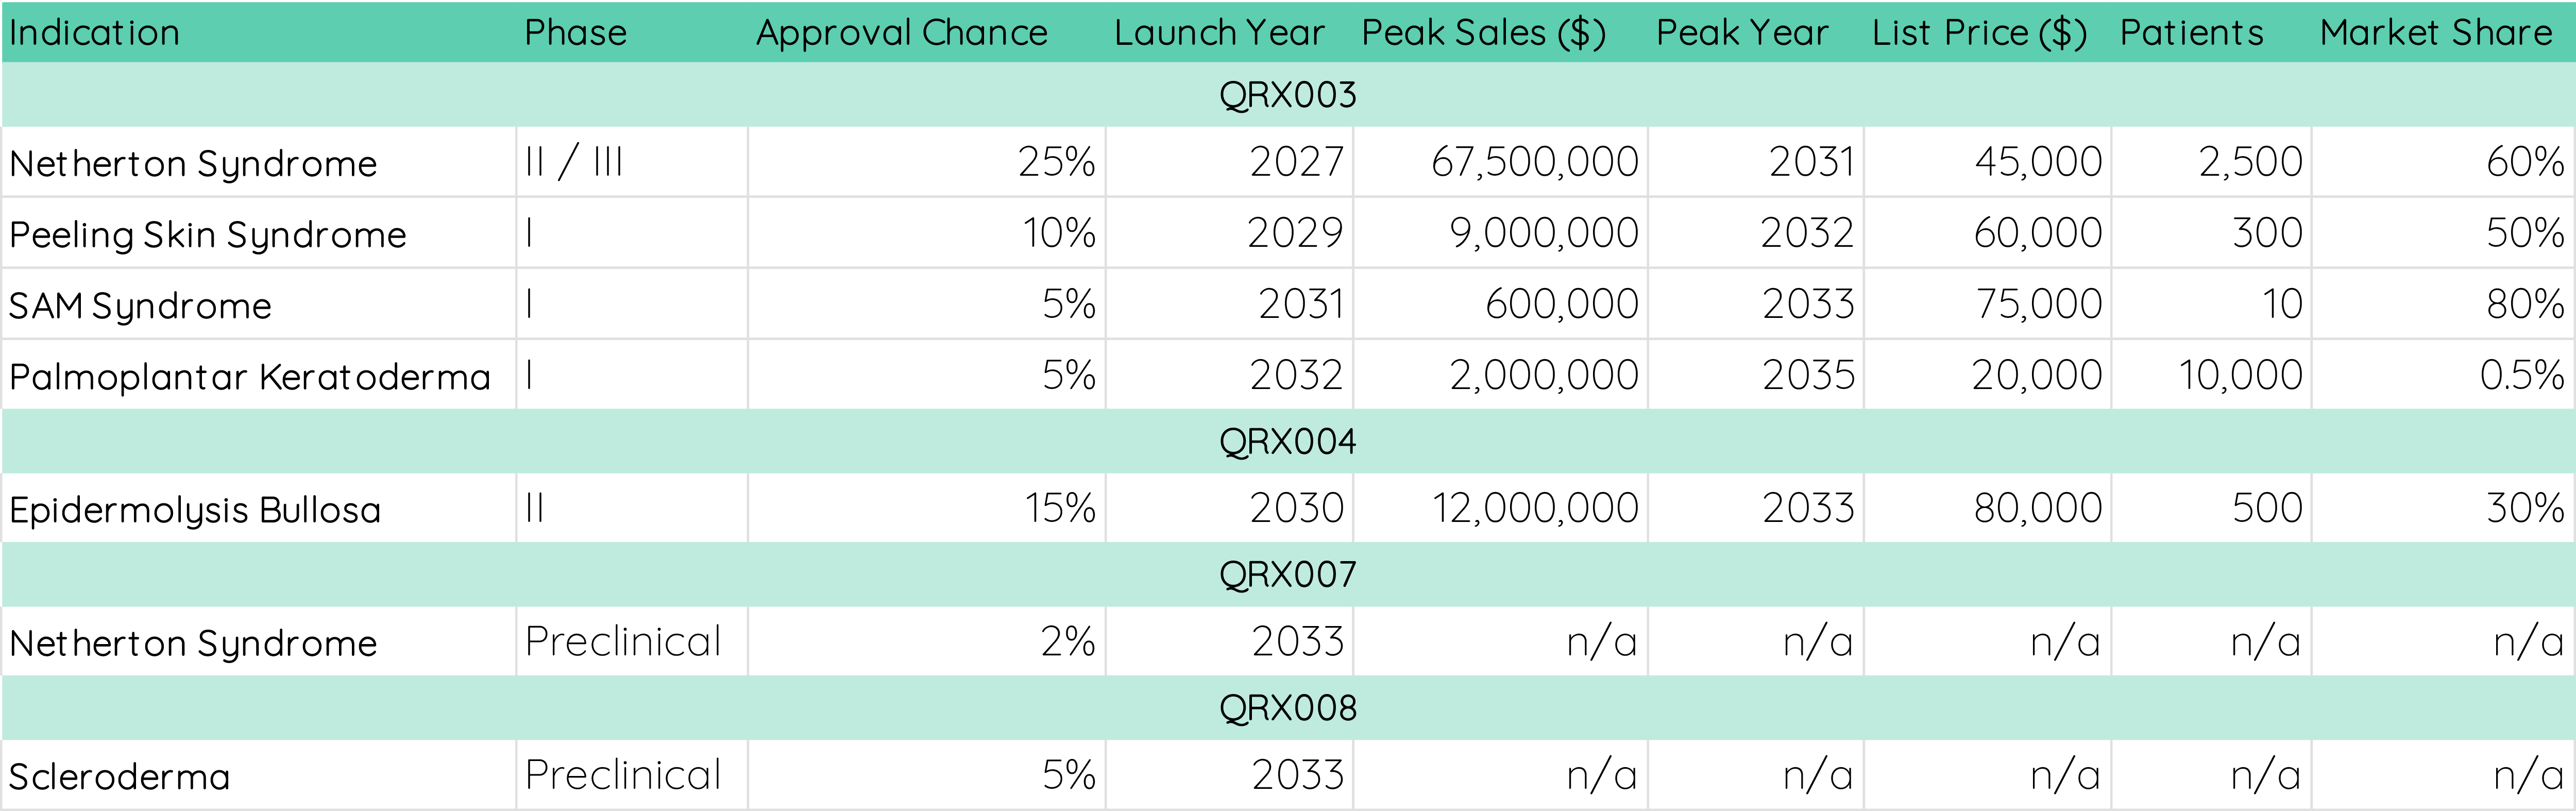
Patient numbers can be found online, but keep in mind that you don’t want to use worldwide numbers. For rare disease treatments, it is important to find out where the treatment could be marketed. For a “quick” solution, US, Europe, and Japan are typically the main markets with the US contributing ~65% of sales, Europe contributing ~25%, and Japan contributing around 10%3.
Market share can be very difficult to estimate depending on the clinical stage of the therapeutic. For QRX003, it is not yet clear whether the treatment would be applicable to children and adults, and whether there is a patient subpopulation for which the treatment may not work. However, early results from the phase 2/3 trial look highly promising, and there is no competitive product on the market yet. Hence, 60% appears to be a reasonable assumption.
Similarly, many factors can contribute to the list price of a treatment such as R&D cost, manufacturing cost, benefit to the patient (efficacy + safety), and the price of competitive therapeutics. For QRX003, Dupixent - an antibody-based cream for atopic dermatitis - was used as a comparison with an annual list price of $37,000. Given the promising results on the efficacy of QRX003 and an excellent safety profile, the model assumes a list price of $45,000.
New treatments typically need some time to reach their peak market share, so it is important to estimate both the year of approval and when sales might peak. For QRX003, based on their progression in clinical trials, we assume a 2027 launch and a 2031 peak4.
Finally, we will have to assume a likelihood of approval, and this could be considered the most important assumption. Depending on the clinical trial stage, treatments have different failure rates. For instance, less than 10% of treatments make it from phase 1 to FDA approval, but around 25-30% of therapeutics in phase 3 trials can be expected to be approved. You can use those benchmarks to estimate the likelihood of approval, but this number will vary a lot based on your research on a company. If the phase 2 trial results of a treatment show very strong efficacy and minor adverse events, you may apply an above-average likelihood of approval and vice versa. For QRX003 in Netherton Syndrome, we chose a conservative value of 25% as only sporadic yet promising results from the phase 2/3 trial are available.
Note: Normally, you would also have to estimate the cost of goods sold (COGS) in such a model, i.e. how much it costs the company to sell the therapeutic. In this analysis, we neglect COGS for simplicity. Because most small molecule therapeutics have margins well over 90%, it is reasonable to ignore COGS for an early-stage biotech to limit the number of assumptions.
You will note that for QRX007 and QRX008, no financial assumptions were made. This is because their expected launch year lies outside of our time horizon. Here, we chose a time horizon of eight years (until 2032)5. If your lead asset is earlier in development, you might choose a longer horizon. If not, make sure you choose a horizon that hits key assumptions like peak sales and market exclusivity for lead assets. Always keep in mind that the longer the time horizon, the less certain the assumptions become.
Step 2: Count the cash flows.
Next, you want to take this data and calculate the expected future cash flows across the time horizon (image below). A simple way to do this is to list the years and the different assets and then fill in the expected revenue.
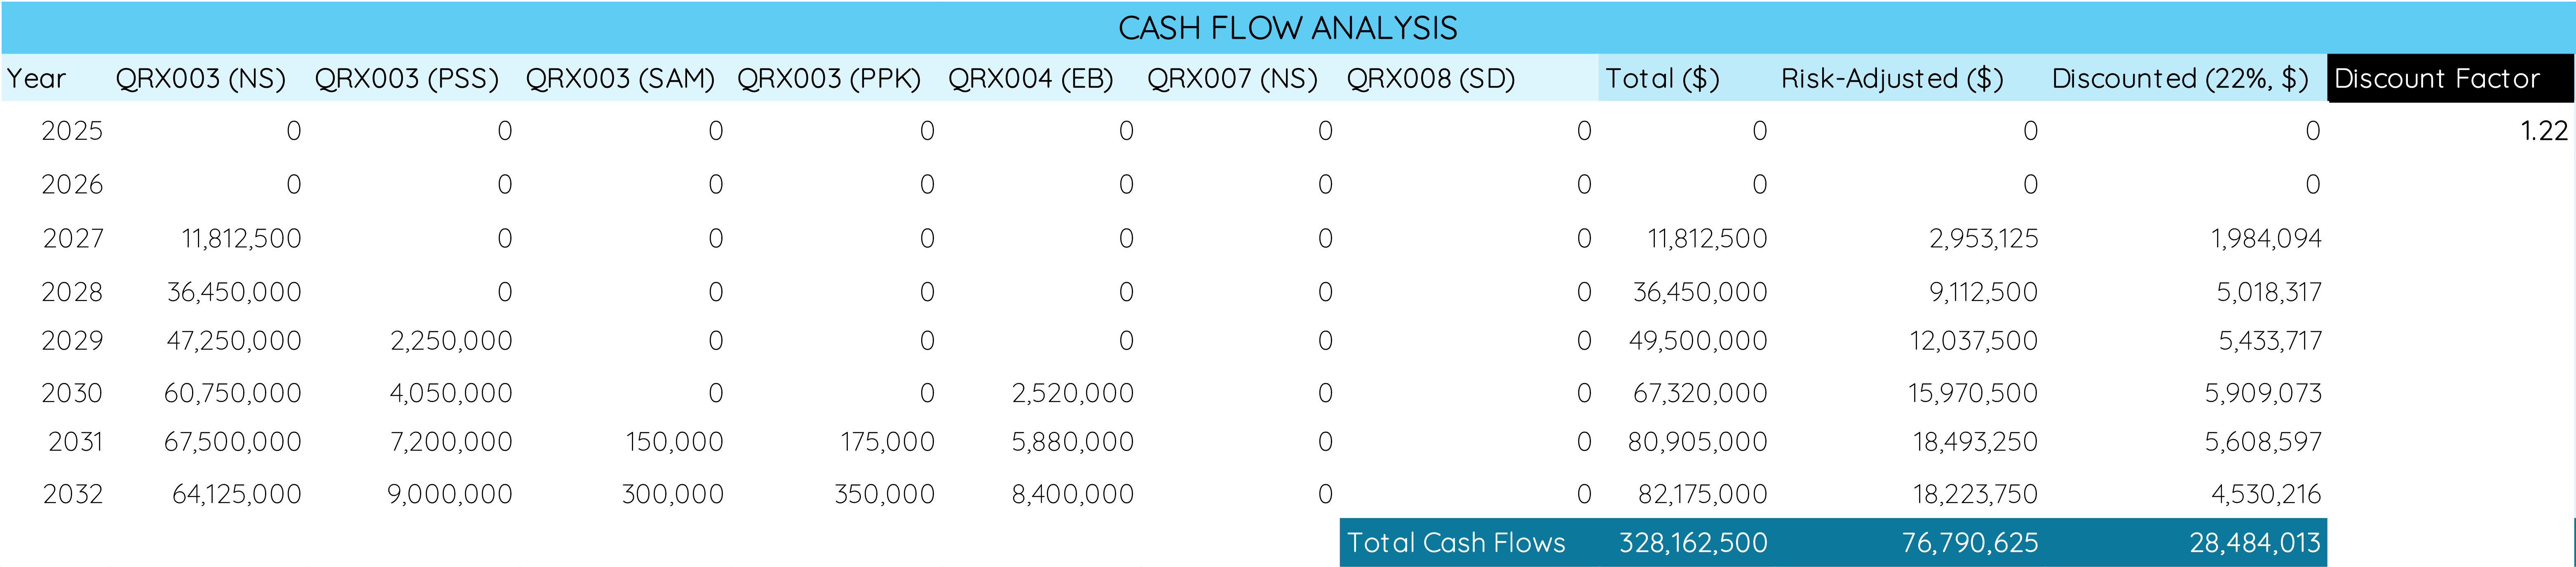
With a market entry for QRX003 in Netherton Syndrome in 2027, you can see that this is where the first revenue comes in for Quoin Pharmaceuticals. We have also estimated peak sales of $67,500,000 in 2031 for QRX003, and for the years until then it is common for sales to increase in an S-like curve. That is, 20-30% of peak sales in the first year, 45-55% in the second year, 70-80% in the third year, and 90-95% in the year prior to peak sales.
After adding potential revenue from other products, you can fill in the total revenue from all products for each year and then sum it all together. In our model, this brings total sales to a peak in 2032 with $82,175,0006 and total cash flows of $328,162,500 by the end of 2032.
Next, we will have to risk-adjust all the cash flows to account for the possibility of failing to secure FDA approval7, abandonment of the program, or regulatory issues. Ensure that you apply the product- and indication-specific probabilities to each column. For instance, we applied a 25% chance of approval for QRX003 in Netherton Syndrome but only a 10% chance of approval in Peeling Skin Syndrome due to the earlier clinical stage. Together, this brings our risk-adjusted total cash flow to $76,790,625 by the end of 2032.
Remember that what we’re trying to do with our valuation is not only to estimate how much money Quoin will earn with their potential products in the future but also what this money is worth today. To do so, we have to discount the future cash flows back to the present by applying a rate which accounts for the risk associated with the company.
In other words, by investing your money into a (biotech) company, you take additional risk, and you hence want additional return. As for Quoin Pharmaceuticals and other biotech companies, there are many risks associated in addition to the likelihood of approval8 such as:
Execution: Even if approved, there are various challenges to manufacturing and commercializing the product such as setting up the supply chain, pricing the product, and managing the insurance reimbursement strategy.
Financing: When clinical data hits setbacks, it becomes very difficult for companies to raise more cash without steep discounts that hurt your investment.
Competition: Other therapeutics may show promise or enter the market
Regulatory Process: Market entry could be delayed if the company faces regulatory delays.
Concentration: Biotech companies often have few clinical-stage assets. The failure of one (e.g., QRX003) can have severe consequences for the development of others.
Because these risks are largely company-wide and not specific to single assets in the pipeline, I would recommend only applying the likelihood of approval directly to the cash projections of single therapeutics (and - potentially - different disease indications) and then feed the additional risks into the discount rate used to discount all cash flows.
In doing so, it is relatively simple to calculate the discount rate for your company-of-interest. Here’s how I came up with 22%:
Risk-Free Rate: You can use the 10-year treasury rate for this → 4.5%
Equity Risk Premium: Stocks are riskier than bonds. → 4%
Biotech Premium: Biotech companies are generally small, and smaller companies are riskier than large ones. Biotech as a sector is also more volatile. → 5%
Clinical Stage Premium: The earlier the stage, the higher the failure rate. Quoin’s lead asset is in phase 2/3 trials for which it is uncertain whether they will suffice for FDA approval → 3%
Company-Specific Risk Premium: There is substantial competition risk, and despite other products being in the pipeline, Quoin’s success is highly dependent on a single asset. The mechanism of their treatment is clearly established and appears effective in early trial results. QRX003 has received orphan drug designation in Europe which provides regulatory advantages. The company is low on cash and will need to finance future trials and commercialization. → 5.5%
You don’t have to be quite as direct. A good question to ask is “how much annualized return do I want to get from this stock to make it worth the risk?”.
This discount rate weighs less on cash flows that are closer in time and more on cash flows that are further in the future. What you then do is take the risk-adjusted cash flow for each year and discount it using the following formula:
Where PV is the current value of the cash flow, FCF is the cash flow for each year, r is the discount rate, and t is the number of years. For instance, for 2030, the formula would look like this:
Where 15,970,500 is the risk-adjusted total revenue, 1+0.22 is the discount rate, 5 is the number of years, and 5,909,073 is the discounted risk-adjusted cash flow for 20309.
Taking these together, we land at a total valuation (or rNPV) of $28,484,013 for Quoin Pharmaceuticals’ future cash flows with a time horizon of eight years.
Step 3: Get a Per-Share Value
Next, we will want to know what this rNPV means for the per-share valuation of Quoin Pharmaceuticals, which is where price and value meet for the first time. As of May 2025, Quoin has 588,000 shares outstanding. Dividing the rNPV by the outstanding shares lands us at a per-share value of $48.44.
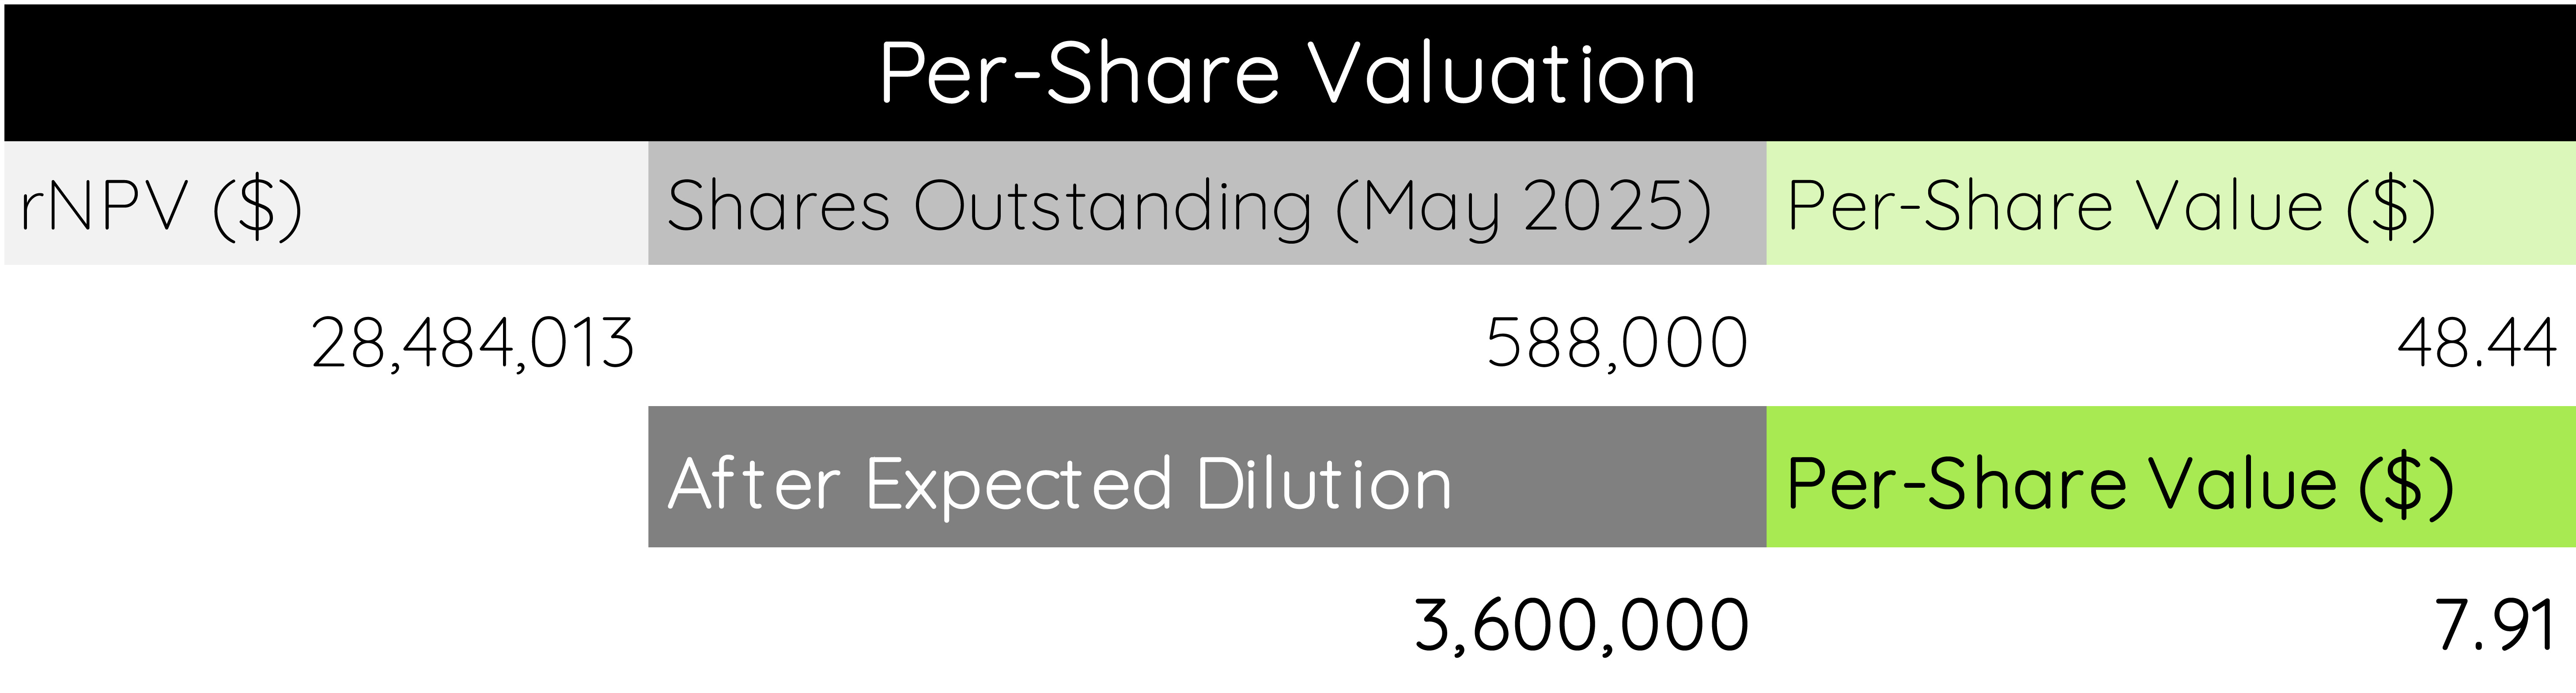
You may note that this is several-fold higher than the current stock price of $8.90 (05/23/2025). This is because we haven’t yet accounted for a crucial factor: expected stock dilution.
You may remember that cash balance was a crucial parameter in part 1 of this guide. As Quoin is holding only cash reserves for the next ~19 months, the company will need to raise a lot of cash in the future to fulfill many of the cash flow assumptions made here. In turn, we have to assume that the pool of outstanding shares will increase quite a bit.
Precisely estimating the amount of future dilution is difficult, however, it is reasonable to assume that Quoin will need a pivotal trial for QRX003 in Netherton Syndrome (~$15,000,000), cash to keep operations running (~$2,500,000 per quarter), a phase 2/3 trial for QRX003 in Peeling Skin Syndrome ($6,000,000), and a phase 3 trial for QRX004 in Epidermolysis Bullosa (~$10,000,000). With cash reserves of ~$14.1 million, we can expect significant dilution to finance these efforts.
In our model, we assume a dilution to ~3.6 million shares within the time horizon, giving each current share a value of $7.9110.

Step 4: Identify Key Value Contributors
As you can see, such analyses implement many assumptions, so optimally we would like to get a feel for how changes in these assumptions impact the overall valuation. A good way to do this is by applying a so-called sensitivity analysis. Analysts often use sensitivity analyses to evaluate key assumptions, identify worst- and best-case scenarios, and stress test their model.
It is not necessary to assess changes in all assumptions. The first step is to select a couple of parameters you think have a big impact on the valuation, and to assess how different values affect the overall per-share valuation.
Because QRX003 for Netherton Syndrome is the lead asset, let’s take a look at how changes in the likelihood of its regulatory approval and list price assumption impact the per-share value.
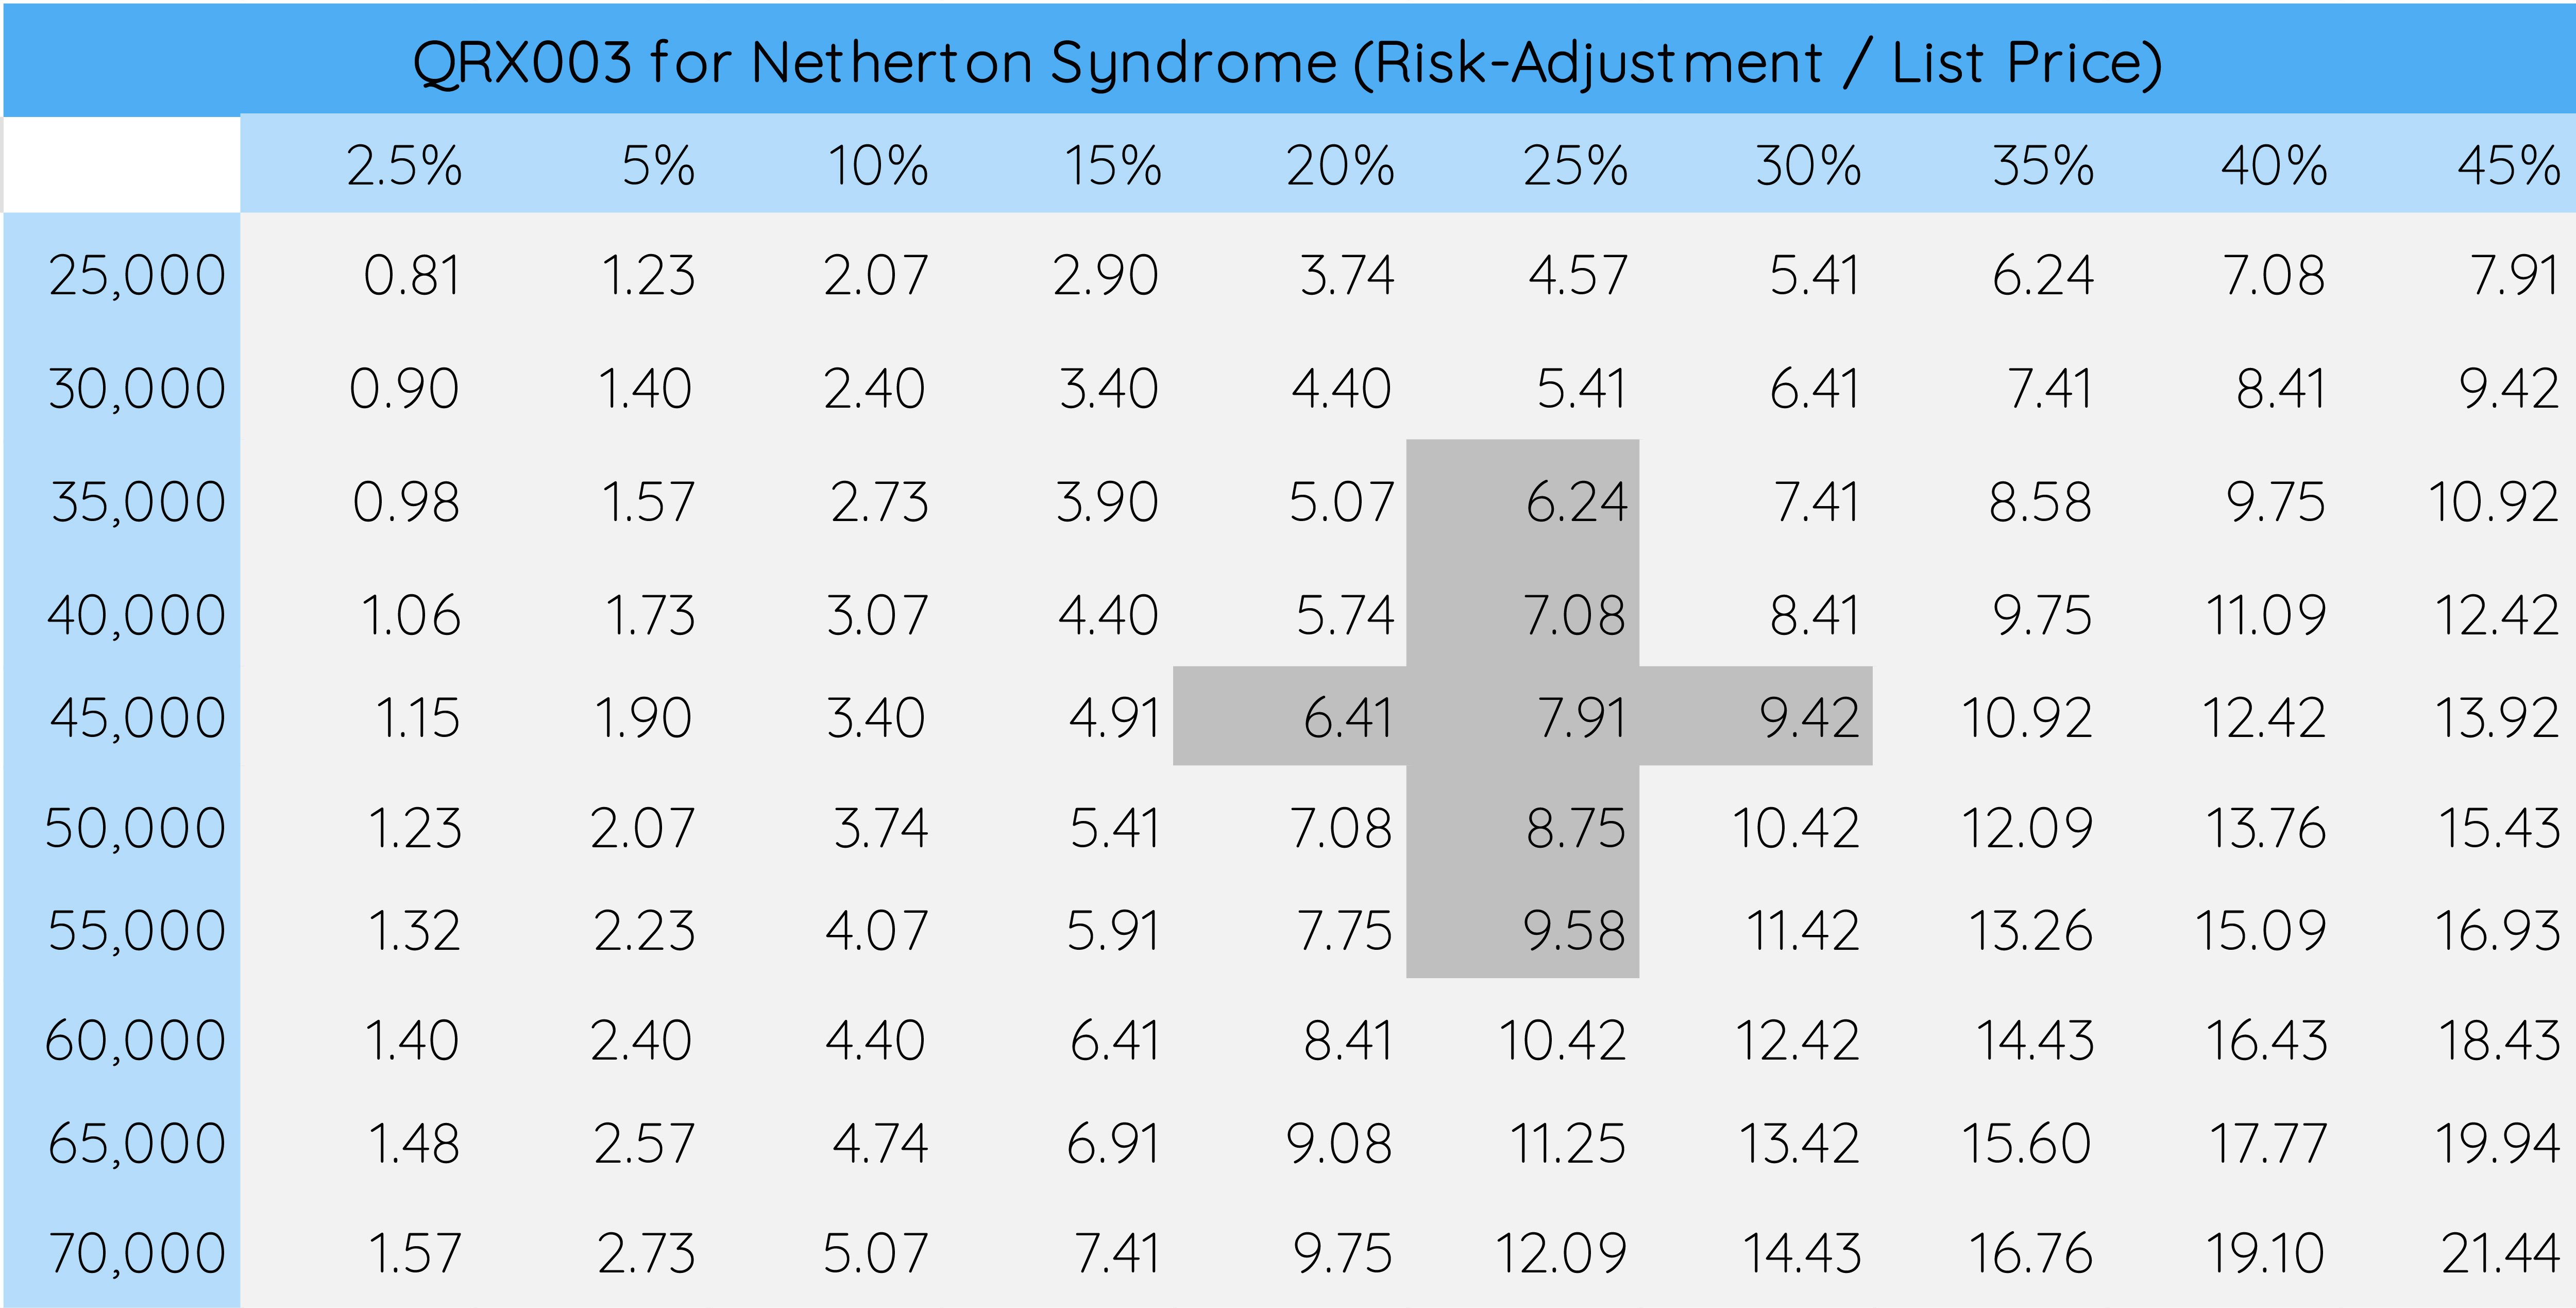
In Excel, you can do this simply by performing a What-If Analysis (YouTube Tutorial Link Below).
To do so, design a table (image above) with a range of assumptions that you deem “reasonable”. For QRX003, we chose risk-adjustment values ranging from 2.5% to 45%. For the list price, we chose values ranging from $25,000 to $70,000. You can tell how - given the importance of QRX003 in Netherton Syndrome to the company - changes in these values can massively impact our per-share valuation, ranging from $0.81 to $21.4411.
Next, we’ll take a look at our company-wide assumptions, i.e. the discount rate and the expected dilution (image below).
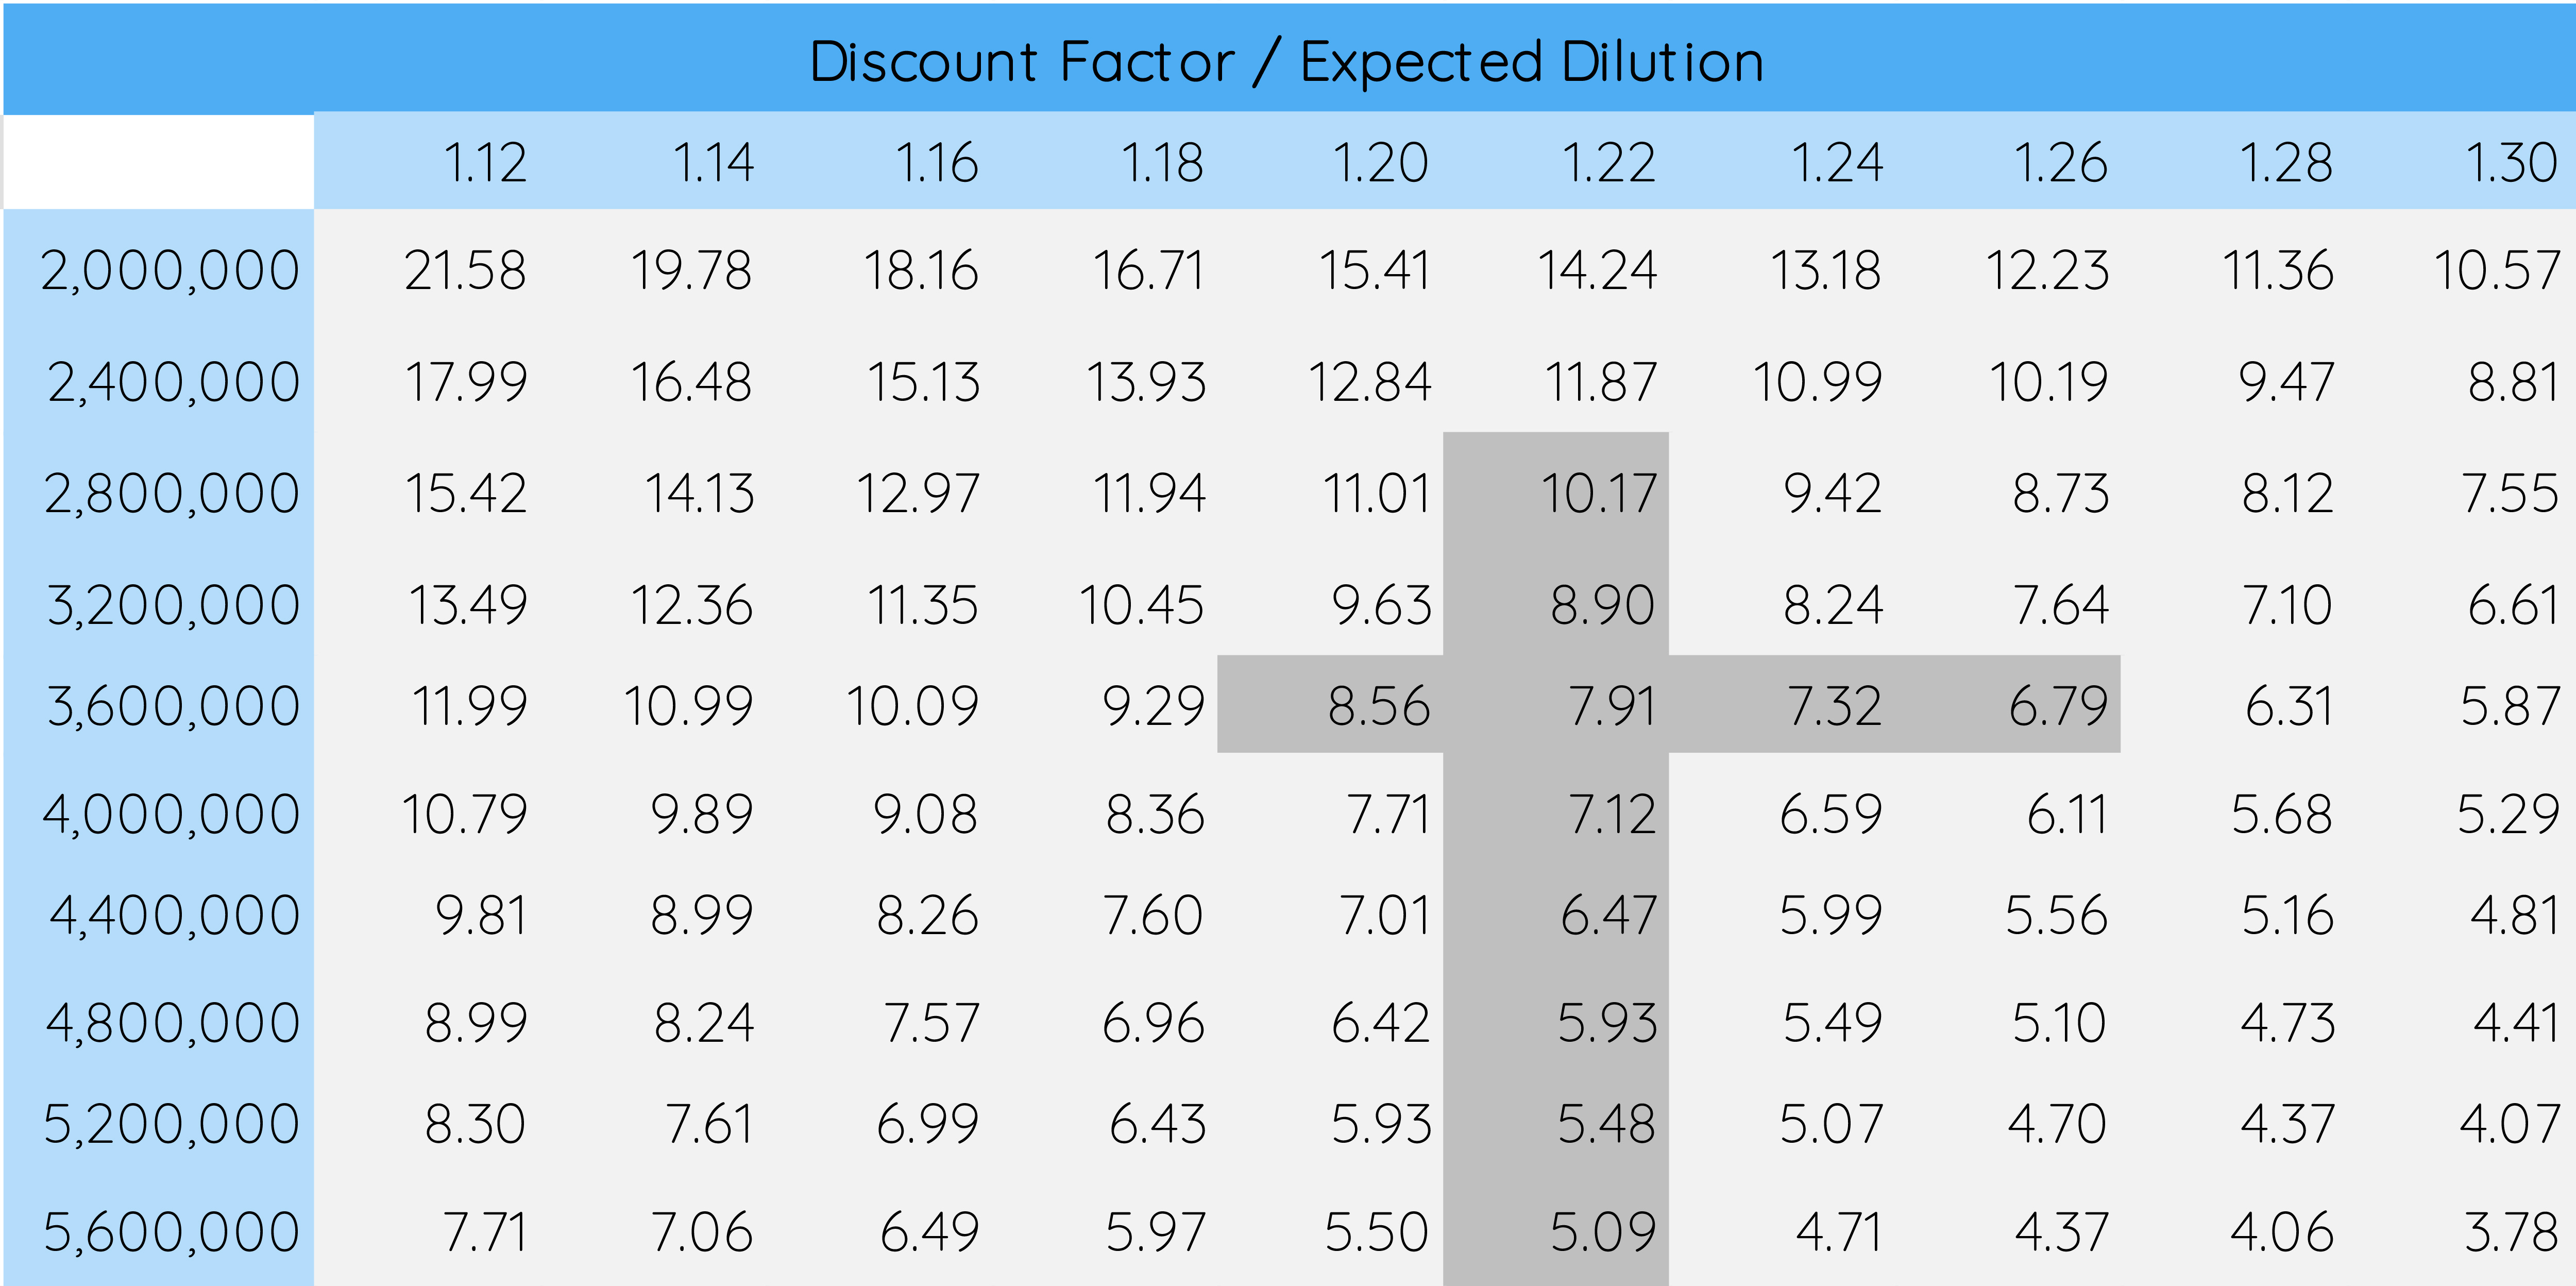
More aggressive discount rates sharply increase the valuation, reaching $11.99 at a 12% discount rate when other values are unchanged. Similarly, reducing the expected dilution to 2,000,000 shares increases the valuation to $14.24 per share. Taken together, the discount factor chosen and the expected dilution strongly affect the overall valuation.
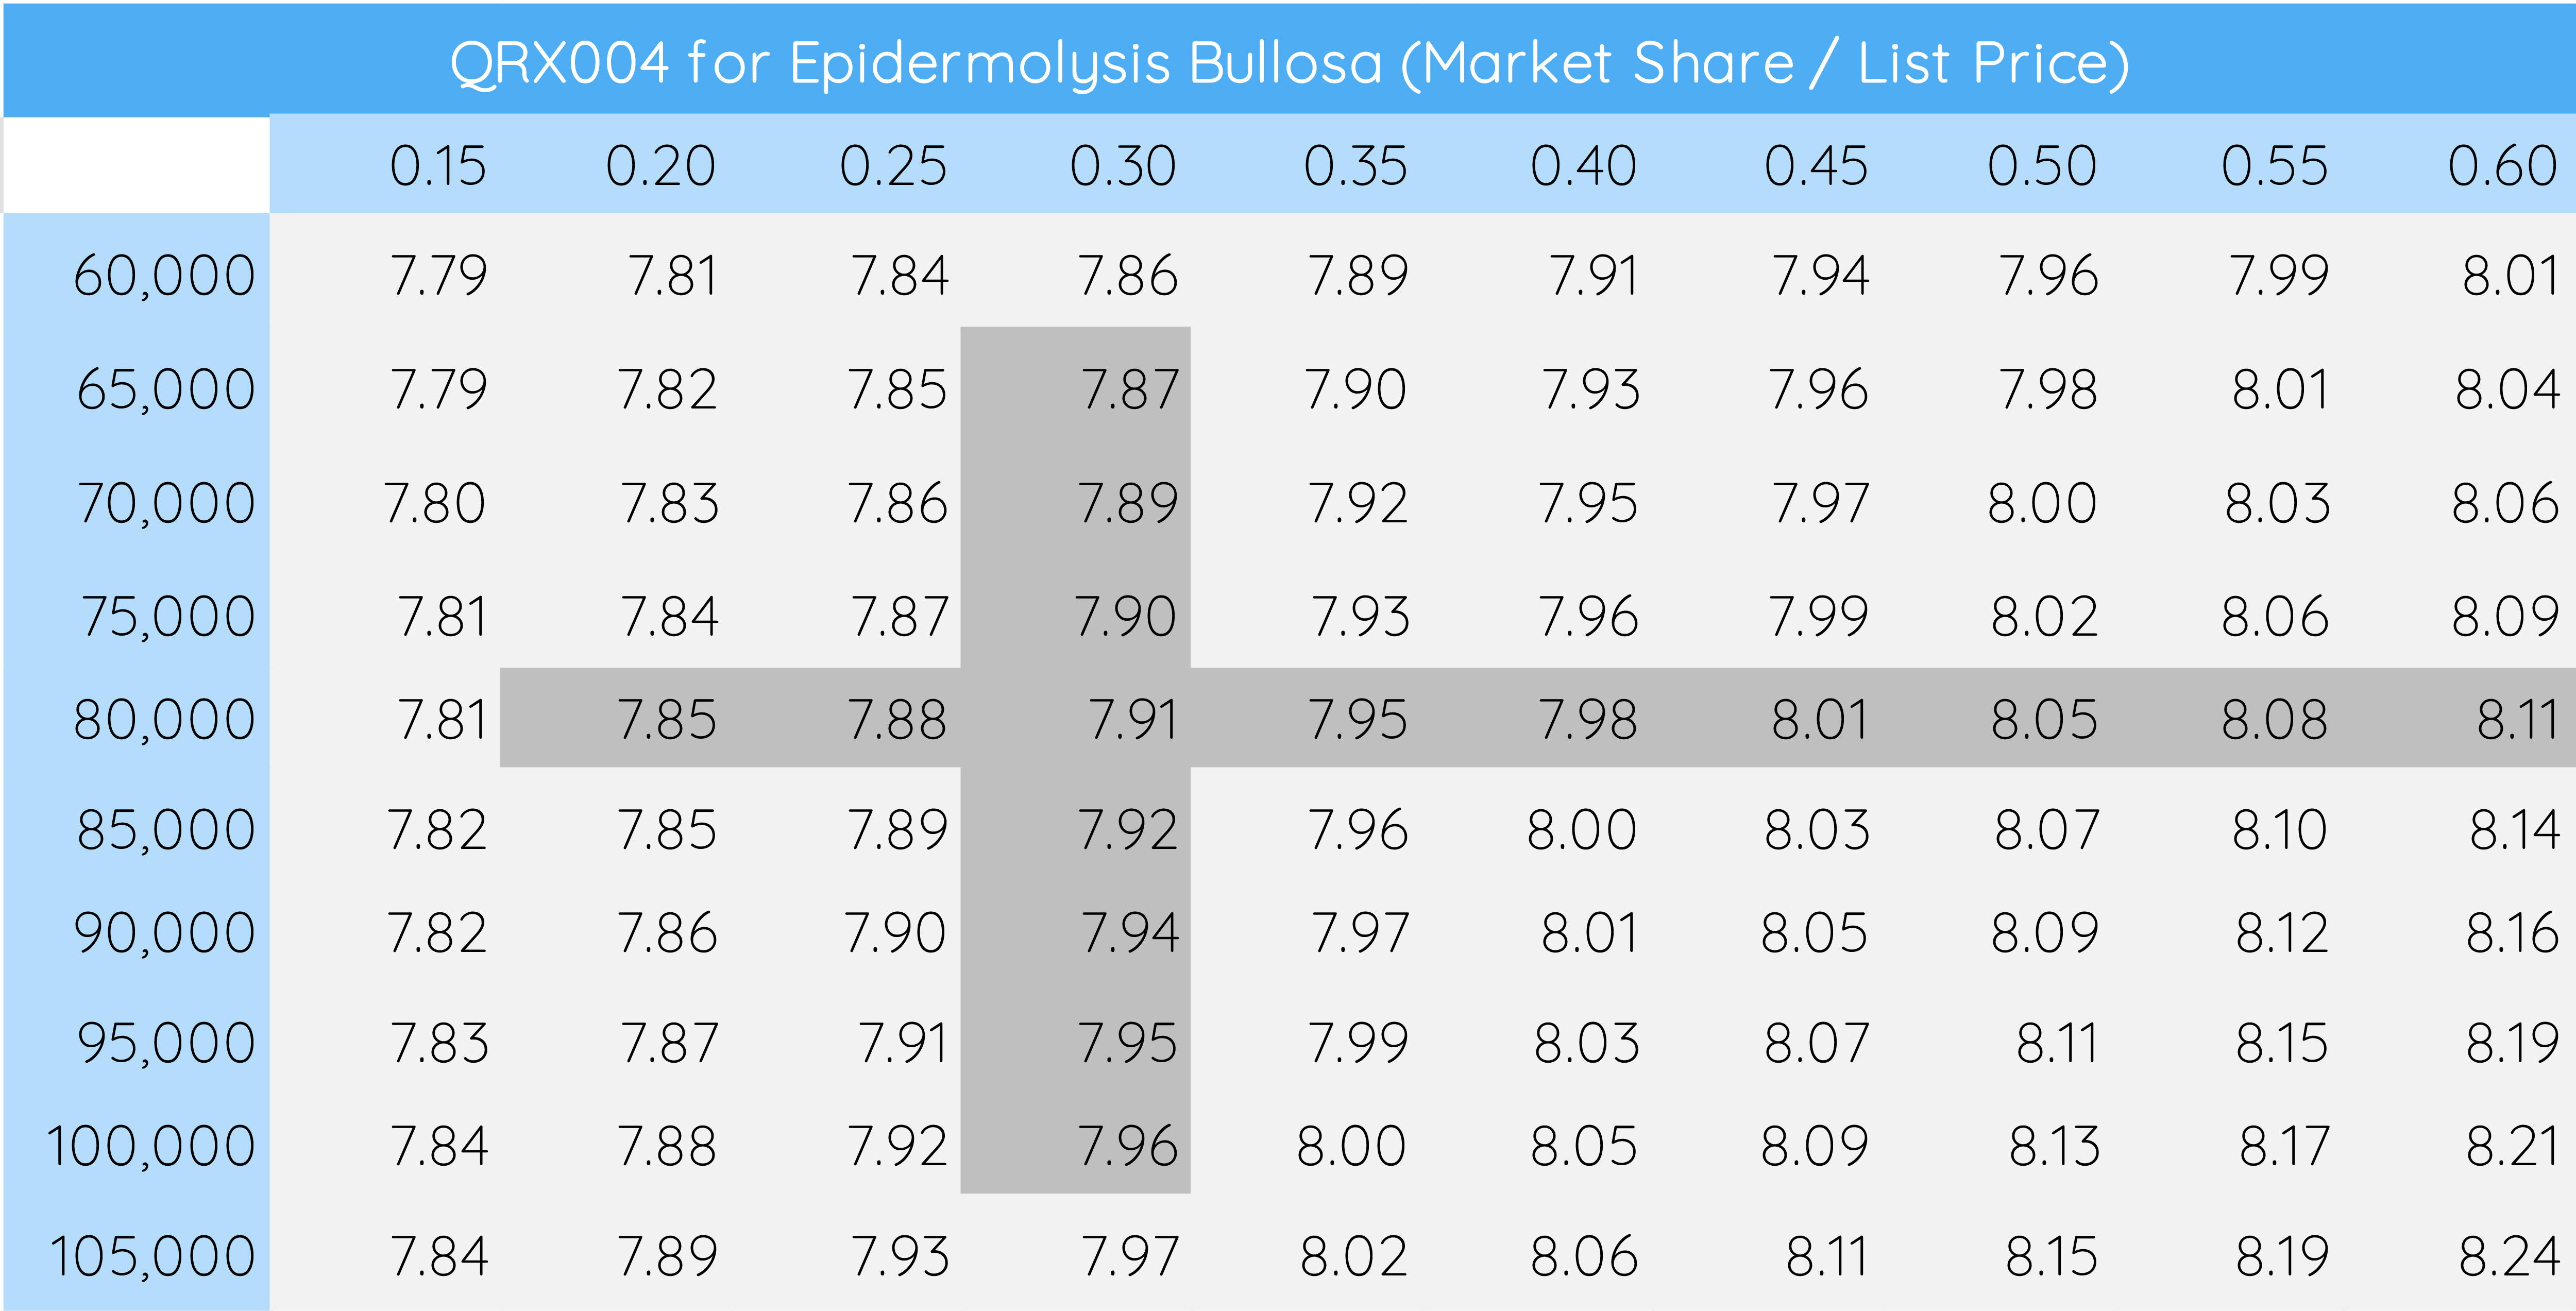
Unsurprisingly, not all assumptions are quite as relevant to the overall model. QRX004, for instance, was assumed to have a market share of ~30% and an annual list price of ~$80,000 in our model. Changing these values from a bear case of 15% ($60,000) to a bull case of 60% ($105,000) only changes the valuation from $7.79 to $8.24 per share (image below), underlining the minimal impact that this program currently has on the company valuation.
By creating such a data table, you can typically tell by eye which components have the largest impact on the valuation, but sometimes it’s good to actually quantify this input.
To do this, we can quantify the degree of valuation changes in response to changes in our assumptions. The first such metric is called a sensitivity coefficient, calculated as
Where delta V is the change in valuation seen for delta X, or the change in the parameter. To calculate this, for instance, subtract the minimal value obtained for the realistic lowest parameter assumption from the maximal value obtained for the highest parameter assumption (image below)12.
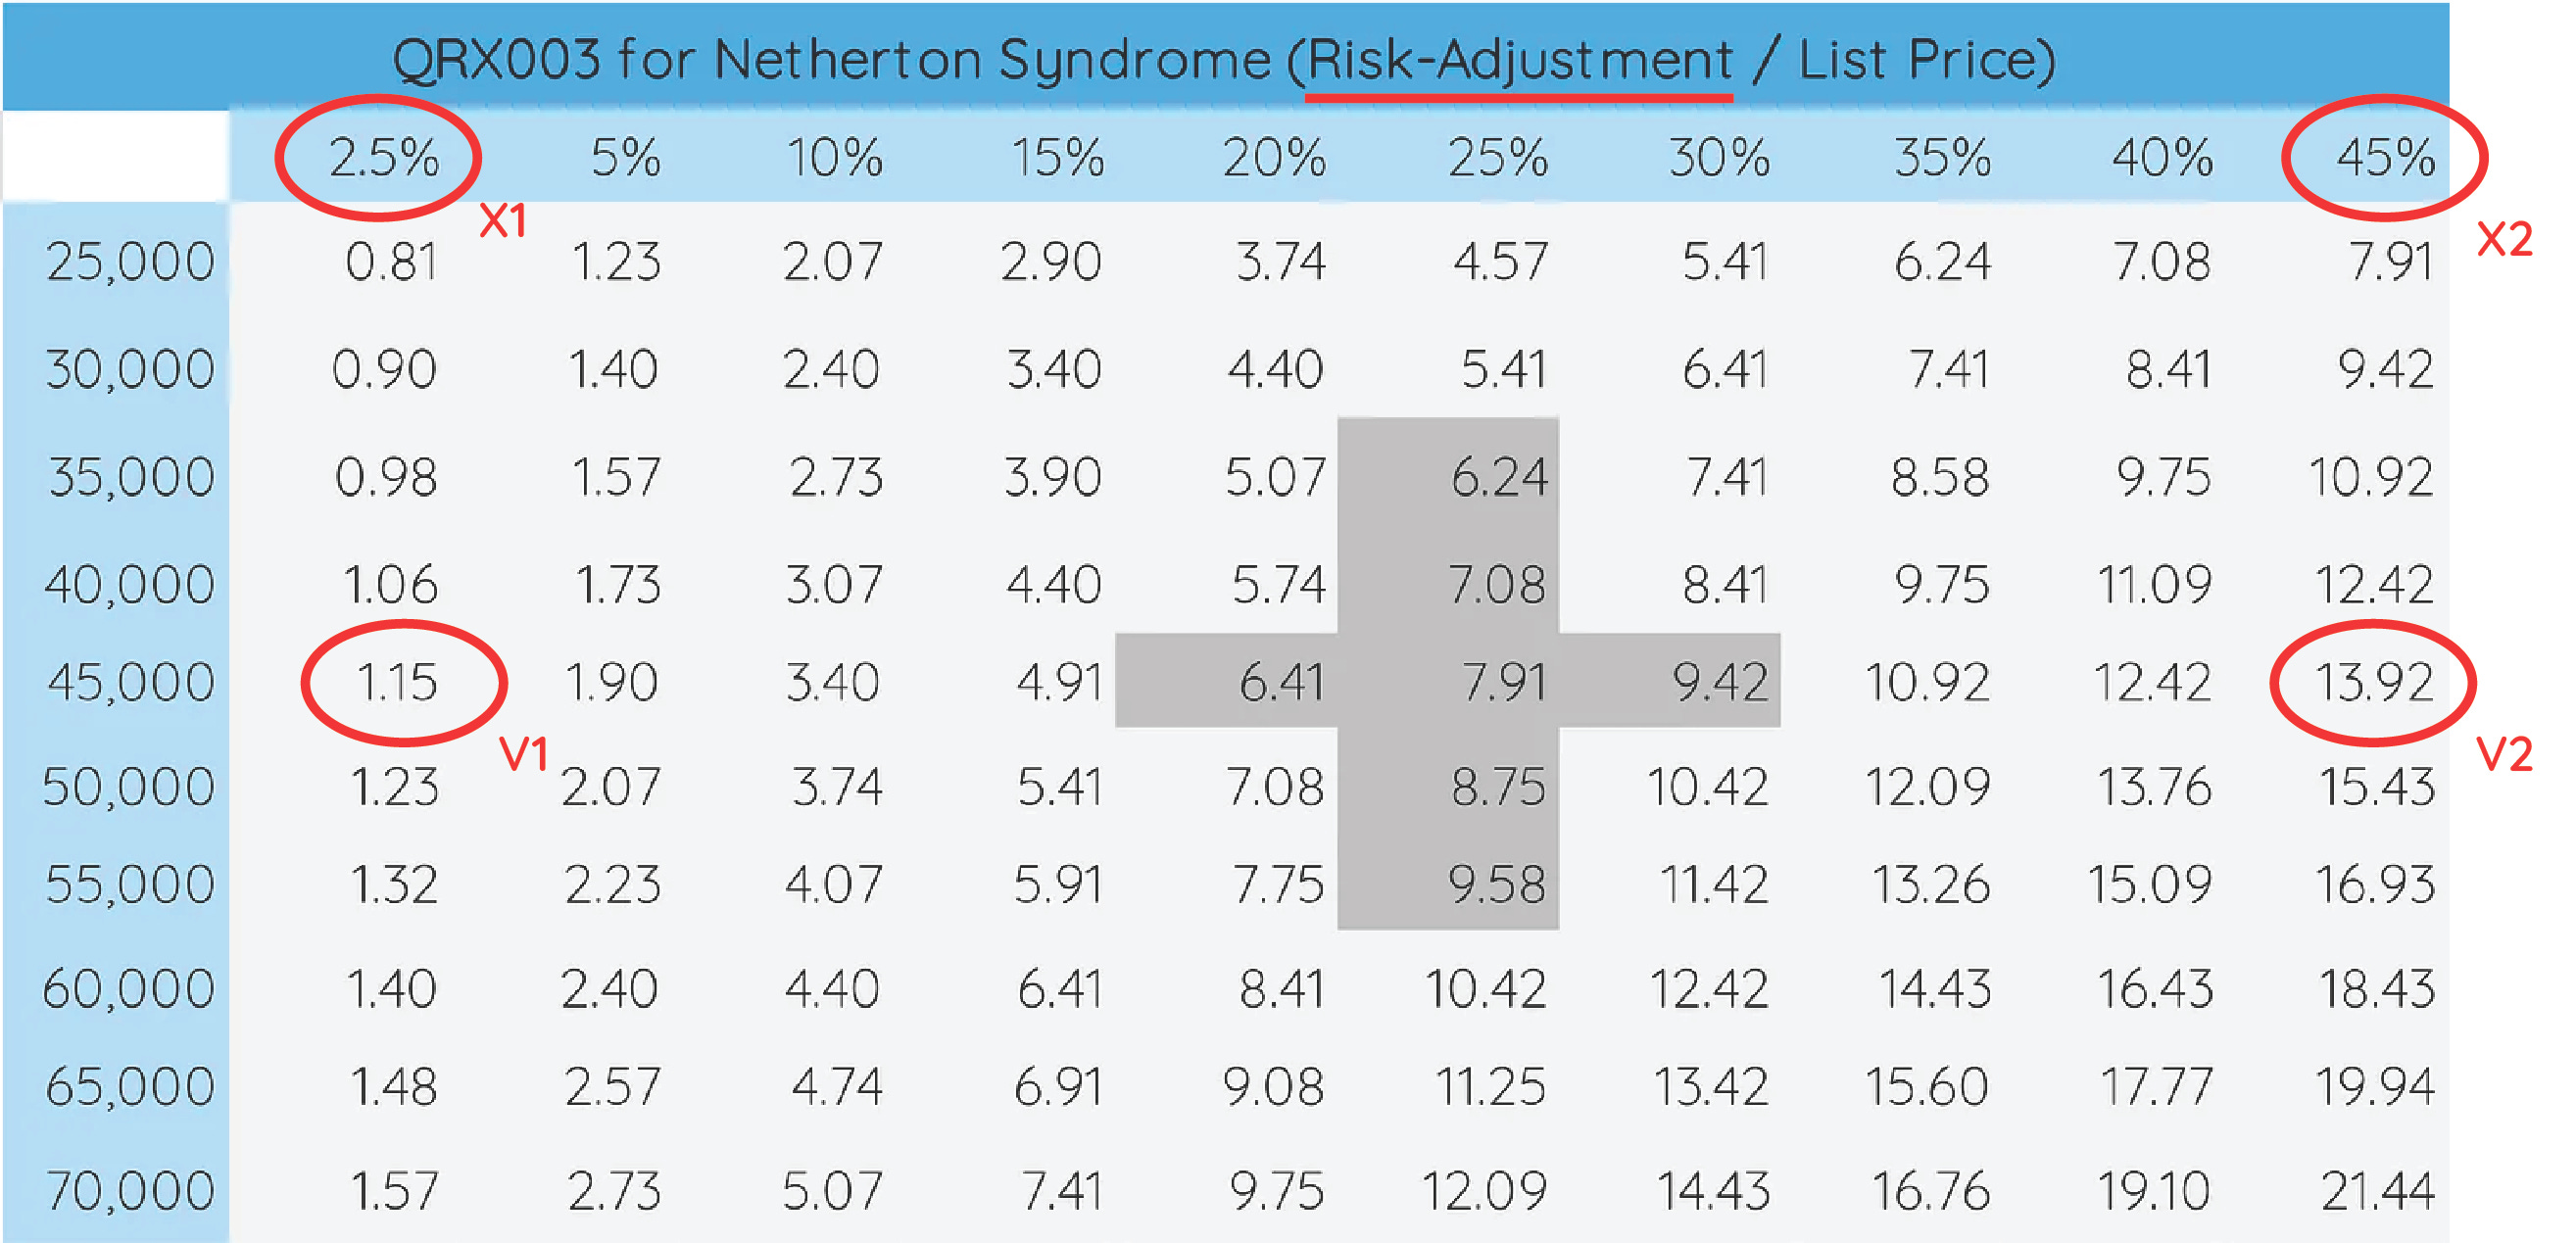
The sensitivity coefficient essentially tells you how much the valuation changes for a unit change in the input parameter. In the case of the risk-adjustment, it tells you the difference in valuation between a 0% probability of approval and a 100% probability of approval, which is $30.06 (image below).
While somewhat informative, typically such parameters don’t change from 0% to 100% overnight. Hence, it is customary to adjust the sensitivity coefficient to a more modest change in the parameter, such as to a 1% change in the likelihood of approval. By dividing the value by 100, we see that a 1% change in the chance of approval leads to a $0.30 change in the per-share valuation of the stock, again showing the dependency of our model on the assumptions made for QRX003 in Netherton Syndrome.
Because the (adjusted) sensitivity coefficient relates to absolute values and assumes a linear relationship between the parameter and the share valuation, it is preferred to compare different parameters with a metric called elasticity. Elasticity essentially tells you in percentage terms how much the per-share value changes as a result of a 1% change in a certain parameter. Because this is a relative and not an absolute value, it is an excellent metric to compare the impact of different parameters on the per-share valuation. Elasticity is calculated using the formula
Applying this to the 6 parameters shown above, this is what their sensitivity coefficients and elasticity look like:

The elasticity value confirms that the risk adjustment of QRX003 and its expected list price severely impact the valuation, impacting it by 0.86% and 0.94% for a 1% change in their assumption13. That is, for every 1% change in the risk-adjustment, the per-share value changes by 0.86%.
Share dilution, unsurprisingly, has an elasticity of -1, meaning that 1% more shares mean 1% less per-share value. This is because we apply the expected dilution last before calculating the per-share value.
Notably, a 1% increase in the discount rate decreases the valuation by 0.78%, emphasizing the importance of carefully choosing the appropriate discount rate for your biotech company.
Changes in the market share and list price assumption for QRX004, on the other hand, barely impact the per-share valuation, with both having an elasticity of 0.03 in our model.
Step 5: Visualize (Optional)

Visualizing your result can help you to identify a range and concentration of possible valuations given your range of assumptions. By simply plotting the valuations for single-parameter changes in the assumption (image above, scenario 0 to 9), we can see that most valuations cross between $5 and $15, suggesting that most of the reasonable valuations are within that range.
This, however, is quite a wide range, so we’ll have to try to narrow it down. Note that a certain value might have a big impact as determined by elasticity, but the range of values that you deem realistic - or highly likely - for this may be smaller than for other values. You may simply be more confident in your assumptions on one parameter, but less confident on another. To represent this, you may want to define “higher confidence” assumptions14.
For instance, on the graph below, all valuations derived from changes in the six chosen single parameters are shown, but only the higher-confidence values are indicated by large markers. This shows that while values between ~$1 and ~$14 are conceivable, only values between ~$6 and ~$10 are realistic for single-parameter changes of higher confidence.

Next, you can put this data into a Tornado Chart. This can show you the expected per-share value changes within your higher confidence range of potential values as derivations from your base case (i.e., the actual assumptions that you made). Doing this on our analysis, we can see that - despite its lower elasticity -we can reasonably see a wider range for higher confidence valuations coming from changes in the discount factor than for any other parameter (image below).

When plotting the same chart for all values derived from single-parameter changes, the largest range comes from the risk-adjustment for QRX003 in Netherton Syndrome (image below). Both plots can be important: The higher confidence plot shows you a reasonable range for the per-share valuation, while plotting all values shows you how much an event such as share dilution, regulatory scrutiny (affecting the discount rate), or a clinical trial result may impact the stock price in the future.

You can also use the values from the sensitivity analysis to calculate a 95% confidence interval for the per-share value15. When only including higher-confidence assumptions, we get 95% CIs of $7.52 to $8.30, suggesting that the current share price lies outside the 95% confidence intervals.
To conclude this part: Our sensitivity analysis shows that the model is very dependent on how QRX003 pans out, and that easily passes the reality check given that it is the de facto lead asset. It also shows that share dilution is very important, and given Quoin’s cash position, that checks out as well. Currently, QRX004 does not contribute much, but that could easily change over time as clinical trial results come out. These models evolve with every new information, and if you do invest in a company, it will be important to update the spreadsheet as key results transpire.
Finally, you can - of course - do such analyses for many more parameters. We have chosen six to simplify the workstream, and for most companies I would suggest performing this analysis for 6 to 10 key parameters.
Step 6: Reach a verdict.
You may know from other articles that Quoin Pharmaceuticals is among my favorite biotech companies out there, and it is a large part of the biotech portfolio that we track on this blog. However, this analysis suggests that the current stock price is a little rich. The main reason for this is a +49% move in the last month, and our model suggests that the stock is trading slightly above fair value ($7.91 vs. $8.90).
Discounted cash flow (DCF) models such as the rNPV used here are very sensitive in the evaluation of biotech companies. This is because the likelihood of approval plays such a major role, and it is quite difficult to put a number on this. By applying this model, you can simply check whether your assumptions about a company support buying the stock at the price it is at. However, one of the key decisions you will make is how wide the range of what you consider a “fair value” is. You could, for instance, model a base case, a pessimistic case, and an optimistic case, and see how all three stack up against the current stock price.
This base case framework will give you accurate company valuations based on your assumptions. One important factor for using this model is being rather conservative with the estimates and discount rate. Biotech asset failures often come surprising, and overestimating the likelihood of approval can be a very costly error. When going through valuations, it is often disheartening to identify a great company with an intriguing therapeutic pipeline only to find out that its current valuation is higher than your estimate. You will, unfortunately, find that a lot of great companies trade at high prices, and in many ways, this can validate your model without leading to an actual investment.
Finally, the rNPV model is not without limitations. For instance, it does not model the possibility of out-licensing or the possibility of M&A. This strategic flexibility is an important factor of company valuation, but it requires advanced modeling, which is what we will look at in part 3 of this series.
Market share can, of course, vary quite a bit by year. For simplicity, you can call this “peak market share”.
This is not always the same, but we treat it the same for this analysis.
This is obviously very disease- and treatment-dependent. It is also noteworthy that Quoin is trying to market QRX003 and QRX004 in China through collaboration with Hong Kong Winhealth Pharma. Quoin has multiple collaborations for other markets which are likely neglectable.
The time it takes to reach peak sales depends on the therapeutic and the market, but 2-4 years is typically a reasonable timeframe for specialty therapeutics.
For your own analysis, you can absolutely change the time horizon. However, be careful with very long time horizons as they become increasingly speculative.
You may wonder why we are not including taxes in our analysis. Bear in mind that biotech companies accumulate ridiculous amounts of Net Operating Loss carryforwards, which effectively reduce their tax rate to zero for several years even after launching a product. The estimate is not included in the analysis, but I would assume a significant tax rate to start affecting Quoin in ~2032-2034.
…and EMA recommendation / PMDA recommendation / MHLW approval if you include Europe and Japan.
This is where your research from part 1 becomes very important, as it will allow you to specifically estimate the risks associated with your company-of-interest.
Note that 2025 is treated as year 0, or the current year.
It might seem counterintuitive to dilute the share pool now for our model. Calculating it this way prevents us from having to assume both how much cash will be raised at different timepoints in the future and what the stock price may be at that time point. Instead, we assume that the cash necessary to fulfill our other assumptions will lead to roughly a six-fold dilution in shares.
For downstream analysis, it may also make sense to highlight values that you consider very realistic as is done in the figure with darker-grey shading. We will come back to these values once we start visualizing our results.
You can also do this the other way around. It does not change the calculation.
Because the likelihood of approval is expressed in percentage terms, that means an 0.01% in the likelihood of approval, or “1% of 1%”.
In the data tables shown above, higher confidence values are shaded.
Here is a good instruction on how to do that in Excel: How to Calculate Confidence Intervals in Excel | DataCamp